. 2014 Oct;55(5):481-97.
doi: 10.3325/cmj.2014.55.481.

A computational model of cerebrospinal fluid production and reabsorption driven by Starling forces

Affiliations
Free PMC article

A computational model of cerebrospinal fluid production and reabsorption driven by Starling forces

Joel Buishas et al. Croat Med J. .
Free PMC article

Abstract

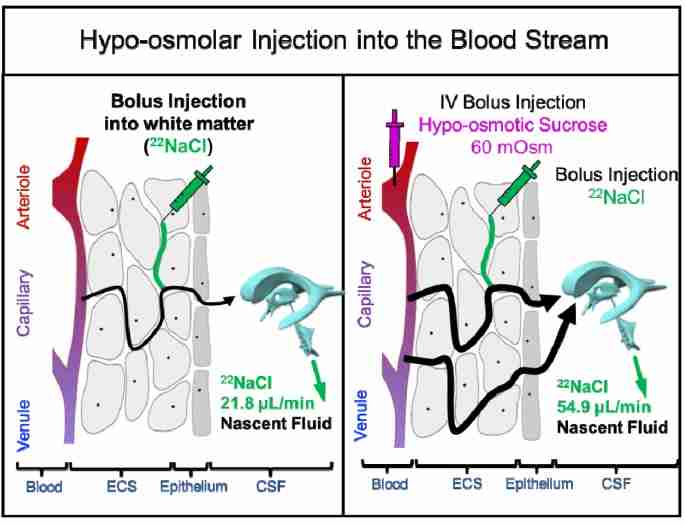
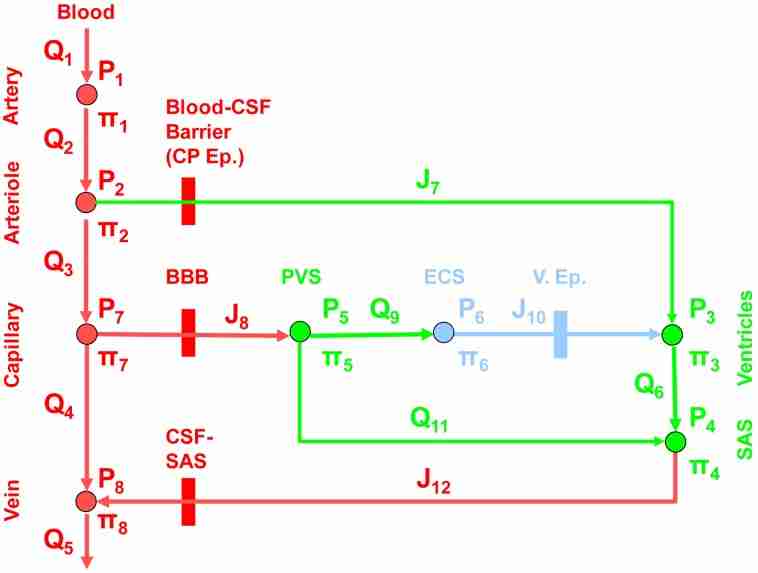
Experimental evidence has cast doubt on the classical model of river-like cerebrospinal fluid (CSF) flow from the choroid plexus to the arachnoid granulations. We propose a novel model of water transport through the parenchyma from the microcirculation as driven by Starling forces. This model investigates the effect of osmotic pressure on water transport between the cerebral vasculature, the extracellular space (ECS), the perivascular space (PVS), and the CSF. A rigorous literature search was conducted focusing on experiments which alter the osmolarity of blood or ventricles and measure the rate of CSF production. Investigations into the effect of osmotic pressure on the volume of ventricles and the flux of ions in the blood, choroid plexus epithelium, and CSF are reviewed. Increasing the osmolarity of the serum via a bolus injection completely inhibits nascent fluid flow production in the ventricles. A continuous injection of a hyperosmolar solution into the ventricles can increase the volume of the ventricle by up to 125%. CSF production is altered by 0.231 μL per mOsm in the ventricle and by 0.835 μL per mOsm in the serum. Water flux from the ECS to the CSF is identified as a key feature of intracranial dynamics. A complete mathematical model with all equations and scenarios is fully described, as well as a guide to constructing a computational model of intracranial water balance dynamics. The model proposed in this article predicts the effects the osmolarity of ECS, blood, and CSF on water flux in the brain, establishing a link between osmotic imbalances and pathological conditions such as hydrocephalus and edema.

Figures

Figure 1
Simplified illustration depicting both the classical and the microvessel hypothesis. The choroid plexus actively creates an ionic concentration gradient between the blood and the ventricles, which drives water transport. The cerebrospinal fluid (CSF) then flows through the ventricles, where it is absorbed through the arachnoid granulations (AG) into the superior sagittal sinus (SSS). CSF is produced and reabsorbed by the capillaries in the parenchyma due to an imbalance in hydrostatic and osmotic pressure, known as Starling force.
Figure 2
Pathways for water exchange in the brain. In addition to blood flow through the vasculature, water can also be filtered through the epithelium of the blood vessels and pass through the blood-brain barrier (BBB) to communicate with the extracellular space (ECS) or the perivascular space (PVS) driven by Starling forces, where it would either flow into the ventricles or leave the system through the subarachnoid space (SAS). Once in the ECS, water can pass between cellular membranes (CM) in the parenchyma or between the Ependymal layer (Ep.) of the ventricles (CSF-LV) following osmotic gradients, where it would flow through the ventricular system and into the SAS before being drained into the superior sagittal sinus. Water can also be transported from the blood to the ventricles via filtration through the choroid plexus epithelium (CP Ep.), which forms the blood-CSF barrier by an active process.
Figure 3
Ventriculo-cisternal perfusion method for studying the physiology of cerebrospinal fluid (CSF) production. The lateral ventricle is continuously injected with artificial CSF containing a dye. Nascent fluid is defined as any fluid that is drawn into the ventricle as a result of osmotic pressure from the capillary bed throughout the extracellular space (ECS) and epithelium. The flow rate of nascent fluid into the ventricle is determined based on the dilution of the dye measured in the collection fluid from the cisterna magna. Qf is calculated using equation 1-2 where Qinj is the bulk flow rate of the perfusion fluid, Qout is the bulk flow rate of the collection fluid, QSAS is the bulk flow rate of the fluid in the SAS, Cinj is the tracer concentration in the perfusion fluid, and Cout is the tracer concentration in the collection fluid.
Figure 4
The effect of bolus injection of sucrose solution into the lateral ventricle during ventriculo-cisternal perfusion (VCP) in a feline model (25). Injection of hypo-osmolar solution was found to completely inhibit nascent fluid flow, while injection of hyperosmolar solution was found to increase the bulk flow of nascent fluid by up to 353%. The osmolarity of the ventricle was determined to alter bulk flow by 0.231 µL per mOsm as reported in the original experiment.
Figure 7
Experimental results showing cisterna magna water accumulation in response to osmotic pressure gradients. (A) Accumulation of radiolabeled water following a bolus injection of hyperosmolar solution into the right lateral ventricle (27), as described in experiment 2. Eight minutes post injection, as shown in the boxed region, the hyperosmolar right ventricle has received nearly twice the amount of radiolabeled water compared to the isotonic left ventricle. (B) The effect of a hypo-osmolar injection into the bloodstream on the bulk flow rate of nascent fluid and movement of radioactive solute from the extracellular space (ECS) into the cisterna magna during ventriculo-cisternal perfusion (VCP) (30) as described in experiment 4. The left y-axis represents the fraction of radioactivity of the collection fluid compared to the injection and the right y-axis represents the bulk flow of nascent fluid. Hypos-osmotic blood increases the rate of water and solute exchange between the ECS and doubles cerebrospinal fluid (CSF) production from 21.8 µL/min to 54.9 µL/min. LV – left ventricle.
Figure 5
The effect of bolus injection of sucrose solution into the femoral artery during ventriculo-cisternal perfusion (VCP) in a feline model (26). Injection of hypo-osmolar solution was found to increase the bulk flow of nascent fluid up to 220%, while injection of hyperosmolar solution completely inhibited nascent fluid flow. The osmolarity of the serum was determined to alter bulk flow by 0.835 µL per Osm as reported in the original experiment.
Figure 6
The effect of a hypo-osmolar injection into the bloodstream on the bulk flow rate of nascent fluid and movement of radioactive solute from the extracellular space (ECS) into the cisterna magna during ventriculo-cisternal perfusion (VCP) (30). Injection of hypo-osmolar solution was found to increase the flow rate of nascent fluid by a factor of 252%.
Figure 8
Data obtained from the measurements of Na+, K+, Cl-, and HCO3- concentration in the serum, choroid plexus epithelium, and cerebrospinal fluid (CSF) and the flux of Na+, K+, and Cl- between the CSF and plasma. Gray arrows indicate passive diffusion down a concentration gradient, black arrows indicate active transport, and striated arrows represent flux across the choroid plexus epithelium. The ionic concentration and flux of (A) sodium, (B) potassium, (C) chloride, and (D) bicarbonate are described. Experimental notation matches the previous sections.
Figure 9
Extravascular water transport in the central nervous system (CNS). Water is filtered from arteriolar capillaries and moves into the extracellular space (ECS). Water is also generated by cellular metabolism. In the ECS, interstitial fluid can either be reabsorbed by the blood vessels or seep through ependymal layer of the ventricles to form nascent cerebrospinal fluid (CSF).
Figure 10
Network model for the flux of blood and water through the compartments of the brain simplified from the diagram in Figure 3. The vasculature is composed of an arterial, arteriolar, capillary, and venous compartment. Water and solute are filtered out of the arteriole blood through the choroid plexus ependymal (CP Ep.) blood- cerebrospinal fluid (CSF) barrier into the ventricles. Water and solute are also filtered from the capillaries through the blood brain barrier (BBB) into the perivascular space (PVS), where transport can occur between the extracellular space (ECS) and the subarachnoid space (SAS). Water moves from the ECS to the ventricles through the ventricular ependymal layer (V. Ep,). CSF moves from the ventricles through the aqueducts to the SAS. Water passes from the SAS through the arachnoid granulations at the CSF-SAS barrier into the veins, where it is drained. Water flux in the simplified network is either convection through the lumen of a blood vessel, Q1-6, 11, transmembrane flux, J7, 8, 10, 12, or transport through a porous medium, Q9. Hydrostatic pressure, P, and osmotic pressure, Π determine the water flux between each compartment.

Similar articles

See all similar articles

Cited by 6 articles

See all "Cited by" articles

References

    1. Sakka L, Coll G, Chazal J. Anatomy and physiology of cerebrospinal fluid. Eur Ann Otorhinolaryngol Head Neck Dis. 2011;128:309–16. doi: 10.1016/j.anorl.2011.03.002. - DOI - PubMed
    1. Shen DD, Artru AA, Adkison KK. Principles and applicability of CSF sampling for the assessment of CNS drug delivery and pharmacodynamics. Adv Drug Deliv Rev. 2004;56:1825–57. doi: 10.1016/j.addr.2004.07.011. - DOI - PubMed
    1. Pardridge WM, editor. The blood–brain barrier: Cellular and molecular biology. New York: Raven; 1993.
    1. Cottrell JE, Smith DS. Anesthesia and neurosurgery. St Louis: Mosby; 2001.
    1. Speake T, Whitwell C, Kajita H, Majid A, Brown PD. Mechanisms of CSF secretion by the choroid plexus. Microsc Res Tech. 2001;52:49–59. doi: 10.1002/1097-0029(20010101)52:1<49::AID-JEMT7>3.0.CO;2-C. - DOI - PubMed

Publication types

Feedback