Association of unconscious race and social class bias with vignette-based clinical assessments by medical students
- PMID: 21900134
- PMCID: PMC3684149
- DOI: 10.1001/jama.2011.1248
Association of unconscious race and social class bias with vignette-based clinical assessments by medical students
Abstract
Context: Studies involving physicians suggest that unconscious bias may be related to clinical decision making and may predict poor patient-physician interaction. The presence of unconscious race and social class bias and its association with clinical assessments or decision making among medical students is unknown.
Objective: To estimate unconscious race and social class bias among first-year medical students and investigate its relationship with assessments made during clinical vignettes.
Design, setting, and participants: A secure Web-based survey was administered to 211 medical students entering classes at Johns Hopkins School of Medicine, Baltimore, Maryland, in August 2009 and August 2010. The survey included the Implicit Association Test (IAT) to assess unconscious preferences, direct questions regarding students' explicit race and social class preferences, and 8 clinical assessment vignettes focused on pain assessment, informed consent, patient reliability, and patient trust. Adjusting for student demographics, multiple logistic regression was used to determine whether responses to the vignettes were associated with unconscious race or social class preferences.
Main outcome measures: Association of scores on an established IAT for race and a novel IAT for social class with vignette responses.
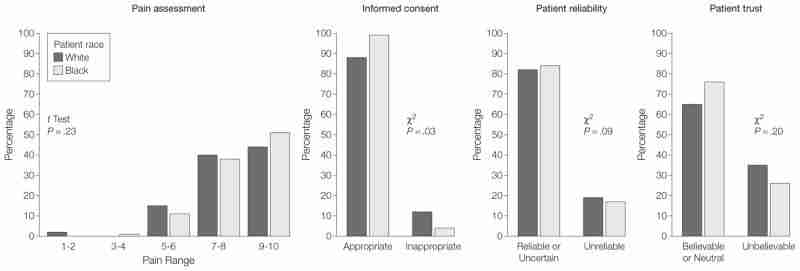
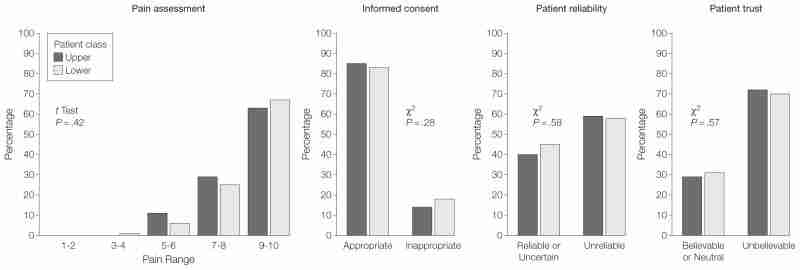
Results: Among the 202 students who completed the survey, IAT responses were consistent with an implicit preference toward white persons among 140 students (69%, 95% CI, 61%-75%). Responses were consistent with a preference toward those in the upper class among 174 students (86%, 95% CI, 80%-90%). Assessments generally did not vary by patient race or occupation, and multivariable analyses for all vignettes found no significant relationship between implicit biases and clinical assessments. Regression coefficient for the association between pain assessment and race IAT scores was -0.49 (95% CI, -1.00 to 0.03) and for social class, the coefficient was -0.04 (95% CI, -0.50 to 0.41). Adjusted odds ratios for other vignettes ranged from 0.69 to 3.03 per unit change in IAT score, but none were statistically significant. Analysis stratified by vignette patient race or class status yielded similarly negative results. Tests for interactions between patient race or class status and student IAT D scores in predicting clinical assessments were not statistically significant.
Conclusions: The majority of first-year medical students at a single school had IAT scores consistent with implicit preference for white persons and possibly for those in the upper class. However, overall vignette-based clinical assessments were not associated with patient race or occupation, and no association existed between implicit preferences and the assessments.
Conflict of interest statement
Figures
Comment in
-
Exploring unconscious bias in disparities research and medical education.JAMA. 2011 Sep 7;306(9):995-6. doi: 10.1001/jama.2011.1275. JAMA. 2011. PMID: 21900142 Free PMC article. No abstract available.
-
Unconscious race and social class bias in medical students.JAMA. 2011 Dec 14;306(22):2454; author reply 2454-5. doi: 10.1001/jama.2011.1770. JAMA. 2011. PMID: 22166602 No abstract available.
Similar articles
-
Unconscious race and social class bias among acute care surgical clinicians and clinical treatment decisions.JAMA Surg. 2015 May;150(5):457-64. doi: 10.1001/jamasurg.2014.4038. JAMA Surg. 2015. PMID: 25786199
-
Unconscious Race and Class Biases among Registered Nurses: Vignette-Based Study Using Implicit Association Testing.J Am Coll Surg. 2015 Jun;220(6):1077-1086.e3. doi: 10.1016/j.jamcollsurg.2015.01.065. Epub 2015 Mar 14. J Am Coll Surg. 2015. PMID: 25998083
-
Unconscious race and class bias: its association with decision making by trauma and acute care surgeons.J Trauma Acute Care Surg. 2014 Sep;77(3):409-16. doi: 10.1097/TA.0000000000000392. J Trauma Acute Care Surg. 2014. PMID: 25159243
-
A Systematic Review of the Impact of Physician Implicit Racial Bias on Clinical Decision Making.Acad Emerg Med. 2017 Aug;24(8):895-904. doi: 10.1111/acem.13214. Epub 2017 Jun 19. Acad Emerg Med. 2017. PMID: 28472533 Review.
-
Implicit bias in healthcare professionals: a systematic review.BMC Med Ethics. 2017 Mar 1;18(1):19. doi: 10.1186/s12910-017-0179-8. BMC Med Ethics. 2017. PMID: 28249596 Free PMC article. Review.
Cited by 70 articles
-
Gender differences in treatments and interventions received by children and adolescents with cerebral palsy.BMC Pediatr. 2020 Jan 30;20(1):45. doi: 10.1186/s12887-020-1926-4. BMC Pediatr. 2020. PMID: 32000727 Free PMC article.
-
The dynamics of poverty, educational attainment, and the children of the disadvantaged entering medical school.Adv Med Educ Pract. 2019 Aug 21;10:667-676. doi: 10.2147/AMEP.S196840. eCollection 2019. Adv Med Educ Pract. 2019. PMID: 31686941 Free PMC article.
-
Racial Differences in Hospital Stays among Patients Undergoing Craniotomy for Tumour Resection at a Single Academic Hospital.Brain Tumor Res Treat. 2019 Oct;7(2):122-131. doi: 10.14791/btrt.2019.7.e29. Brain Tumor Res Treat. 2019. PMID: 31686443 Free PMC article.
-
Implicit gender bias among US resident physicians.BMC Med Educ. 2019 Oct 29;19(1):396. doi: 10.1186/s12909-019-1818-1. BMC Med Educ. 2019. PMID: 31660944 Free PMC article.
-
Association of Racial Bias With Burnout Among Resident Physicians.JAMA Netw Open. 2019 Jul 3;2(7):e197457. doi: 10.1001/jamanetworkopen.2019.7457. JAMA Netw Open. 2019. PMID: 31348503 Free PMC article.
Publication types
MeSH terms
Grant support
LinkOut - more resources
-
Full Text Sources
-
Other Literature Sources
-
Medical
