. 2010 Jan;30(1):162-76.
doi: 10.1038/jcbfm.2009.206. Epub 2009 Sep 30.

Trafficking of glucose, lactate, and amyloid-beta from the inferior colliculus through perivascular routes

Affiliations
Free PMC article

Trafficking of glucose, lactate, and amyloid-beta from the inferior colliculus through perivascular routes

Kelly K Ball et al. J Cereb Blood Flow Metab. .
Free PMC article

Abstract

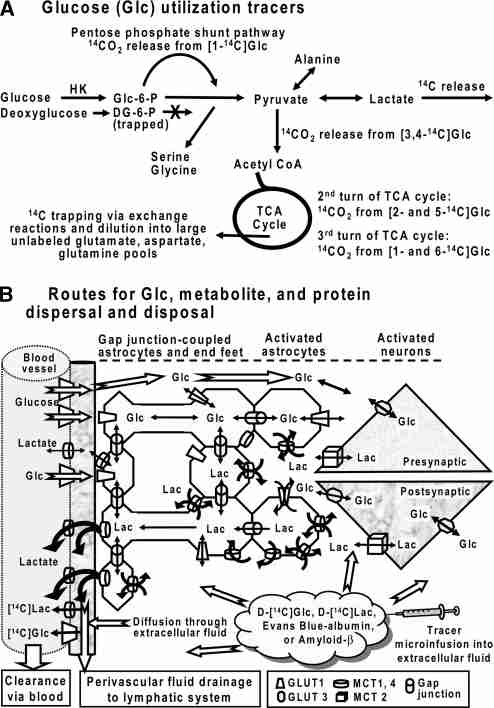
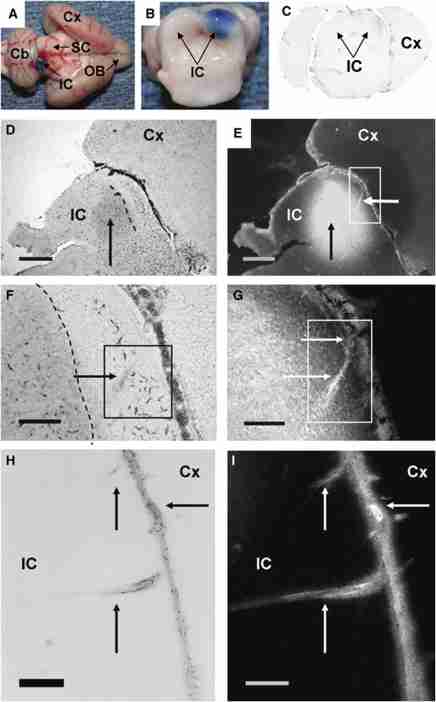
Metabolic brain imaging is widely used to evaluate brain function and disease, and quantitative assays require local retention of compounds used to register changes in cellular activity. As labeled metabolites of [1- and 6-(14)C]glucose are rapidly released in large quantities during brain activation, this study evaluated release of metabolites and proteins through perivascular fluid flow, a pathway that carries solutes from brain to peripheral lymphatic drainage sites. Assays with [3,4-(14)C]glucose ruled out local oxidation of glucose-derived lactate as a major contributor of label loss. Brief infusion of [1-(14)C]glucose and D-[(14)C]lactate into the inferior colliculus of conscious rats during acoustic stimulation labeled the meninges, consistent with perivascular clearance of [(14)C]metabolites from interstitial fluid. Microinfusion of Evans blue albumin and amyloid-beta(1-40) (Abeta) caused perivascular labeling in the inferior colliculus, labeled the surrounding meninges, and Abeta-labeled-specific blood vessels in the caudate and olfactory bulb and was deposited in cervical lymph nodes. Efflux of extracellular glucose, lactate, and Abeta into perivascular fluid pathways is a normal route for clearance of material from the inferior colliculus that contributes to underestimates of brain energetics. Convergence of 'watershed' drainage to common pathways may facilitate perivascular amyloid plaque formation and pathway obstruction in Alzheimer's disease.

Figures

Figure 1
Spreading and clearance of labeled glucose, glucose metabolites, and exogenous protein in activated brain. (A) The first irreversible step of glucose (Glc) metabolism is phosphorylation by hexokinase (HK), a reaction that is commonly assayed with labeled deoxyglucose (DG) and determination of local accumulation of DG-6-phosphate (DG-6-P), which is trapped intracellularly and not further metabolized by the glycolytic pathway (Sokoloff et al, 1977). Local rates of glucose usage during brain activation are underestimated with labeled glucose because of incomplete trapping of labeled metabolites. Label can be lost by decarboxylation reactions in various pathways and efflux of lactate and other compounds from activated tissue. Note that lactate retains all of the label in the precursor glucose except that lost through the pentose shunt pathway. (B) Schematic diagram of (i) glucose uptake into brain from blood and release of lactate from activated tissue to blood and perivascular fluid flow through pathways involving intracellular trafficking among gap junction-coupled astrocytes and diffusion through extracellular fluid (see Introduction and Discussion), and (ii) infusion of tracers (14C-labeled -glucose or -lactate, Evans Blue albumin, and amyloid-β) used in this study to assay release of labeled metabolites from the inferior colliculus through perivascular–meningeal pathways and to visualize the perivascular routes from inferior colliculus to the cervical lymphatic system. (Panel B was modified from Gandhi et al, 2009a, with permission.)
Figure 2
Figure 2
14C-labeled metabolites of [3,4-14C]glucose in extracellular fluid. [3,4-14C]Glucose was microinfused into the inferior colliculus of conscious rats (n=5) for 40 mins during rest and acoustic stimulation; the infusion was discontinued during the 20 mins recovery interval. Samples of microdialysate were collected during 10 min intervals and total dpm determined (A); then each microdialysate sample was separated into three fractions, CO2, neutral plus cationic compounds, and acidic compounds (see Materials and methods). In spite of the constant infusion rate determined in vitro for each microinfusion probe after each experiment, tissue labeling was quite variable (A), perhaps because of partial obstruction of the probe by tissue in vivo. The proportion of dpm recovered in each fraction was, therefore, expressed as % of the total in that dialysate sample for each animal (B). Note that the glucose fraction (Dowex 1 column effluent fraction) would also contain neutral amino acids and other neutral and cationic compounds, but label in amino acids and cationic compounds was negligible (see Materials and methods). In addition, the acidic fraction would contain labeled lactate and perhaps some pyruvate, but not labeled TCA cycle-derived acidic amino acids (glutamate and aspartate) because all label in pyruvate/lactate would be released as 14CO2 at the pyruvate dehydrogenase step. Differential metabolite capture was not the basis for the low dialysate 14CO2 level (B) because the efficiency of recovery of 14CO2 from standard solutions of H14CO3 into microdialysis probes was 11.4±2.4% (n=3), somewhat higher than 7.5±1.3% for [14C]lactate determined previously (Table V of Cruz et al, 2007). Values are means and vertical bars represent 1 s.d. *P<0.05, two-tailed paired t test.
Figure 3
Dispersal of labeled glucose and -lactate within brain and analysis of 14C-labeled compounds in dissected meninges. (A) [1-14C]Glucose (n=6) or (B) -[14C]lactate (n=4) was microinfused into the inferior colliculus of conscious rats for 5 mins, and labeling of grossly dissected brain regions and meningeal membranes determined. R and L denote structures dissected from the right (R, ipsilateral to infused inferior colliculus) and left (L, contralateral) hemisphere. Compounds labeled by [1-14C]glucose and recovered in meningeal membranes (A) were separated by HPLC, as shown in a representative profile (C); relative quantities of 14C recovered in five major HPLC fractions in all six meningeal samples are shown in (D). Values are means and vertical bars represent 1 s.d.
Figure 4
Labeling of inferior colliculus and perivascular structures by Evans blue albumin and amyloid-β. Inferior colliculus viewed from (A) the dorsal surface after reflection of the cerebral hemispheres, (B) the caudal direction after removal of the cerebellum, and (C) a coronal section. (A, B) Meningeal labeling after a 5 min microinfusion of Evans blue-bound albumin into conscious rats. (C) Localized distribution of immunolabeled Aβ1−40 after injection of Cy5-labeled Aβ1−40 into the right inferior colliculus. Coronal sections of inferior colliculus in brightfield (D, F, H) and Evans blue albumin fluorescence (E, G, I) show the distribution of Evans blue albumin within the inferior colliculus (vertical arrows, D, E) after a 5 min microinfusion into conscious rats. Prominent labeling of a blood vessel (white arrow, E) that leads from the inferior colliculus to the meninges is shown at higher power (arrows, F, G). The boundary of the Evans blue dye is demarcated by a dashed line in (D) and (F). Blood vessels in the inferior colliculus (vertical arrows H, I) that merge with the meninges exhibit perivascular labeling. Meninges contains a cross-section view of a blood vessel (horizontal arrows, H, I), and small labeled vessels extend from the meninges into cerebral cortex (H, I). Note the smaller areas of the visible blue dye (D, F, H) compared with the more sensitive fluorescent images (E, G, I). Scale bars=800 μm in (D, E); 250 μm in (F, G); 200 μm in (H, I). Cb, cerebellum; IC, inferior colliculus; SC, superior colliculus; Cx, cerebral cortex; OB, olfactory bulb.
Figure 5
Cessation of blood flow increases perivascular labeling by Evans blue albumin. Representative fluorescence (A, B, D, E, F) and brightfield (C) images of inferior colliculus after a 5 min microinfusion of Evans blue albumin into euthanized rats. Note the perivascular labeling and unlabeled lumen of many blood vessels (arrows, A), one of which (vertical arrows in box, A) is illustrated in cross section (B). This vessel was cut in cross section along its route from inferior colliculus to the meninges (vertical arrows, B). The inset in panel B shows an adjacent serial coronal section containing a portion of the same vessel that is in a different plane; the vessel segment in the inset is located between the vertical arrows in (B). Note the ‘thicker', more pronounced perivascular labeling (C, D) compared with that in a conscious animal with pulsatile blood flow (Figures 4E to 4G). The left-facing black arrows in (C) indicate two vessels that connect to the meninges; the white arrow denotes the approximate location of the tip of the guide cannula. The boxes in (C), (D), and (E) are shown at higher power in (D), (E), and (F), respectively. Note the spread of fluorescent label along the tissue–meninges margin (D to F) from a large vessel that originates in highly labeled tissue (C to F). The scale bars=800 μm in (A), (C), and (D); 250 μm in (B) and inset of (B); 200 μm in (E), and 125 μm in (F).
Figure 6
Perivascular labeling in the inferior colliculus by Cy5–Aβ. (A) Brightfield image of a caudal coronal section of inferior colliculus (IC) bordered by cerebral cortex (Cx) and cerebellum (Cb); the boxed region in (A) is shown at higher power in (C). Fluorescence images of Cy5-Aβ at 5 mins (B to E) after its microinfusion or at 60 mins after its injection (F, G) into inferior colliculus of conscious rats. A prominent blood vessel with strong perivascular Cy5–Aβ labeling traverses from the highly labeled ventral region of the inferior colliculus to the tissue–meninges border (arrows, B, C); note that the vessel is cut in cross section and it traverses tissue into and out of the plane of sectioning. Perivascular labeling of a small vessel at the tissue–meninges margin (right facing arrow, D) that is located far from the cannula track (not visible) and infusion site (left facing arrow, D) is shown at higher power in (E); arrows indicate two sections of the same vessel that is cut by the plane of sectioning. (F) Fluorescent image of distribution of Cy5–Aβ within the inferior colliculus and extensive perivascular labeling of many blood vessels; note that the vascular lumen is not labeled (horizontal arrows). The inset (f) shows two labeled vessels (arrows) at the margin of the tissue; the upper one is more highly labeled than the lower one. The fine structure of a labeled vessel in the boxed area in (F) is shown in (G, vessel is rotated 90° clockwise); note the fine perivascular labeling along the vessel and a small branching vessel similar to that obtained with Evans blue albumin (Figure 4I). Cb, cerebellum; IC, inferior colliculus; Cx, cerebral cortex. The scale bar=400 μm in (B) and (D) and applies to (A); 100 μm in (C) and (E); 800 μm in (F); and 20 μm in (G).
Figure 7
Selective perivascular labeling by Cy5–Aβ in the caudate-putamen, frontal cortex, olfactory bulbs, and cervical lymph nodes. Cy5–Aβ was infused into the inferior colliculus of conscious rats for 90 mins. (A) Hematoxylin and eosin-stained coronal section at the level of the caudate-putamen. The boxed area in (A) is shown in representative merged Cy5–Aβ fluorescence-differential interference contrast (DIC) images (C, E, and the inset e). Selective, strong perivascular labeling of blood vessels (arrows) by Cy5–Aβ contrasts the low tissue labeling in serial coronal sections (C, E, e); note the preferential ‘light', unilateral labeling of the tissue by Cy5–Aβ in the left ventral caudate compared with the right side (C, E). (B) Brightfield image of immunolabeled coronal section showing high diaminobenzidine staining of the meninges surrounding the frontal cortex (FC) and olfactory bulbs (OB). The boxed areas in (B) are shown at higher magnification in (D) and (F), which are merged DIC-Cy5 fluorescence images; arrows identify specific blood vessels with high perivascular Cy5 labeling. (G) DIC image of a cervical lymph node and (H) fluorescence image of Cy5–Aβ in the same section; dashed line in (G) corresponds to that in (H). The scale bar=400 μm in (C) and applies to (C, E, e, G, and F); bar=100 μm in (D, G, H). Cx, cerebral cortex; CC, corpus callosum; AC, anterior commissure; v, ventricle; LOT, lateral olfactory tract; OC, optic chiasm.

Similar articles

See all similar articles

Cited by 33 articles

See all "Cited by" articles

Publication types

Feedback