Cortical and leptomeningeal cerebrovascular amyloid and white matter pathology in Alzheimer's disease
- PMID: 12865947
- PMCID: PMC1430731
Cortical and leptomeningeal cerebrovascular amyloid and white matter pathology in Alzheimer's disease
Abstract
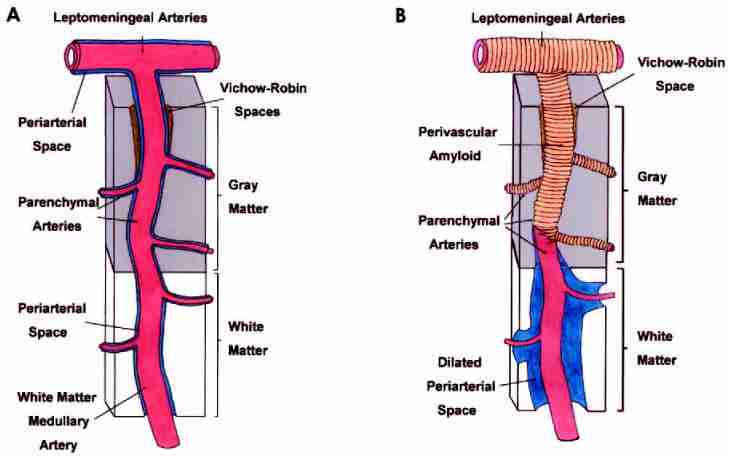
Alzheimer's disease (AD) is characterized by neurofibrillary tangles and by the accumulation of beta-amyloid (Abeta) peptides in senile plaques and in the walls of cortical and leptomeningeal arteries as cerebral amyloid angiopathy (CAA). There also is a significant increase of interstitial fluid (ISF) in cerebral white matter (WM), the pathological basis of which is largely unknown. We hypothesized that the accumulation of ISF in dilated periarterial spaces of the WM in AD correlates with the severity of CAA, with the total Abeta load in the cortex and with Apo E genotype. A total of 24 AD brains and 17 nondemented age-matched control brains were examined. CAA was seen in vessels isolated from brain by using EDTA-SDS lysis stained by Thioflavin-S. Total Abeta in gray matter and WM was quantified by immunoassay, ApoE genotyping by PCR, and dilatation of perivascular spaces in the WM was assessed by quantitative histology. The study showed that the frequency and severity of dilatation of perivascular spaces in the WM in AD were significantly greater than in controls (P< 0.001) and correlated with Abeta load in the cortex, with the severity of CAA, and with ApoE epsilon4 genotype. The results of this study suggest that dilation of perivascular spaces and failure of drainage of ISF from the WM in AD may be associated with the deposition of Abeta in the perivascular fluid drainage pathways of cortical and leptomeningeal arteries. This failure of fluid drainage has implications for therapeutic strategies to treat Alzheimer's disease.
Figures
Similar articles
-
Cerebral amyloid angiopathy: amyloid beta accumulates in putative interstitial fluid drainage pathways in Alzheimer's disease.Am J Pathol. 1998 Sep;153(3):725-33. doi: 10.1016/s0002-9440(10)65616-7. Am J Pathol. 1998. PMID: 9736023 Free PMC article.
-
Capillary and arterial cerebral amyloid angiopathy in Alzheimer's disease: defining the perivascular route for the elimination of amyloid beta from the human brain.Neuropathol Appl Neurobiol. 2003 Apr;29(2):106-17. doi: 10.1046/j.1365-2990.2003.00424.x. Neuropathol Appl Neurobiol. 2003. PMID: 12662319
-
Cerebral amyloid angiopathy: accumulation of A beta in interstitial fluid drainage pathways in Alzheimer's disease.Ann N Y Acad Sci. 2000 Apr;903:110-7. doi: 10.1111/j.1749-6632.2000.tb06356.x. Ann N Y Acad Sci. 2000. PMID: 10818495 Review.
-
APOE epsilon 4 influences the pathological phenotype of Alzheimer's disease by favouring cerebrovascular over parenchymal accumulation of A beta protein.Neuropathol Appl Neurobiol. 2003 Jun;29(3):231-8. doi: 10.1046/j.1365-2990.2003.00457.x. Neuropathol Appl Neurobiol. 2003. PMID: 12787320
-
Perivascular drainage of amyloid-beta peptides from the brain and its failure in cerebral amyloid angiopathy and Alzheimer's disease.Brain Pathol. 2008 Apr;18(2):253-66. doi: 10.1111/j.1750-3639.2008.00133.x. Brain Pathol. 2008. PMID: 18363936 Review.
Cited by 79 articles
-
Perivascular Unit: This Must Be the Place. The Anatomical Crossroad Between the Immune, Vascular and Nervous System.Front Neuroanat. 2020 Apr 16;14:17. doi: 10.3389/fnana.2020.00017. eCollection 2020. Front Neuroanat. 2020. PMID: 32372921 Free PMC article. Review.
-
A venous mechanism of ventriculomegaly shared between traumatic brain injury and normal ageing.Brain. 2020 Jun 1;143(6):1843-1856. doi: 10.1093/brain/awaa125. Brain. 2020. PMID: 32372102 Free PMC article.
-
Increased Presence of Cerebral Microbleeds Correlates With Ventricular Enlargement and Increased White Matter Hyperintensities in Alzheimer's Disease.Front Aging Neurosci. 2020 Jan 31;12:13. doi: 10.3389/fnagi.2020.00013. eCollection 2020. Front Aging Neurosci. 2020. PMID: 32082141 Free PMC article.
-
Endothelial Immune Activation by Medin: Potential Role in Cerebrovascular Disease and Reversal by Monosialoganglioside-Containing Nanoliposomes.J Am Heart Assoc. 2020 Jan 21;9(2):e014810. doi: 10.1161/JAHA.119.014810. Epub 2020 Jan 13. J Am Heart Assoc. 2020. PMID: 31928157 Free PMC article.
-
Increased Diameters of the Internal Cerebral Veins and the Basal Veins of Rosenthal Are Associated with White Matter Hyperintensity Volume.AJNR Am J Neuroradiol. 2019 Oct;40(10):1712-1718. doi: 10.3174/ajnr.A6213. Epub 2019 Sep 12. AJNR Am J Neuroradiol. 2019. PMID: 31515212 Free PMC article.
Publication types
MeSH terms
Substances
Grant support
LinkOut - more resources
-
Full Text Sources
-
Other Literature Sources
-
Medical
-
Miscellaneous